Sales Reports by Period
Sales between two dates compared with the previous period — revenue, orders, average order value, new customers, payment breakdown, hourly profile, top products — with the same tabs, print and e-mail as the daily report.
Period Sales Reports is the daily report stretched over any date range: a week, a month, a quarter. Every figure is compared with the previous period of the same length, which makes trends visible.
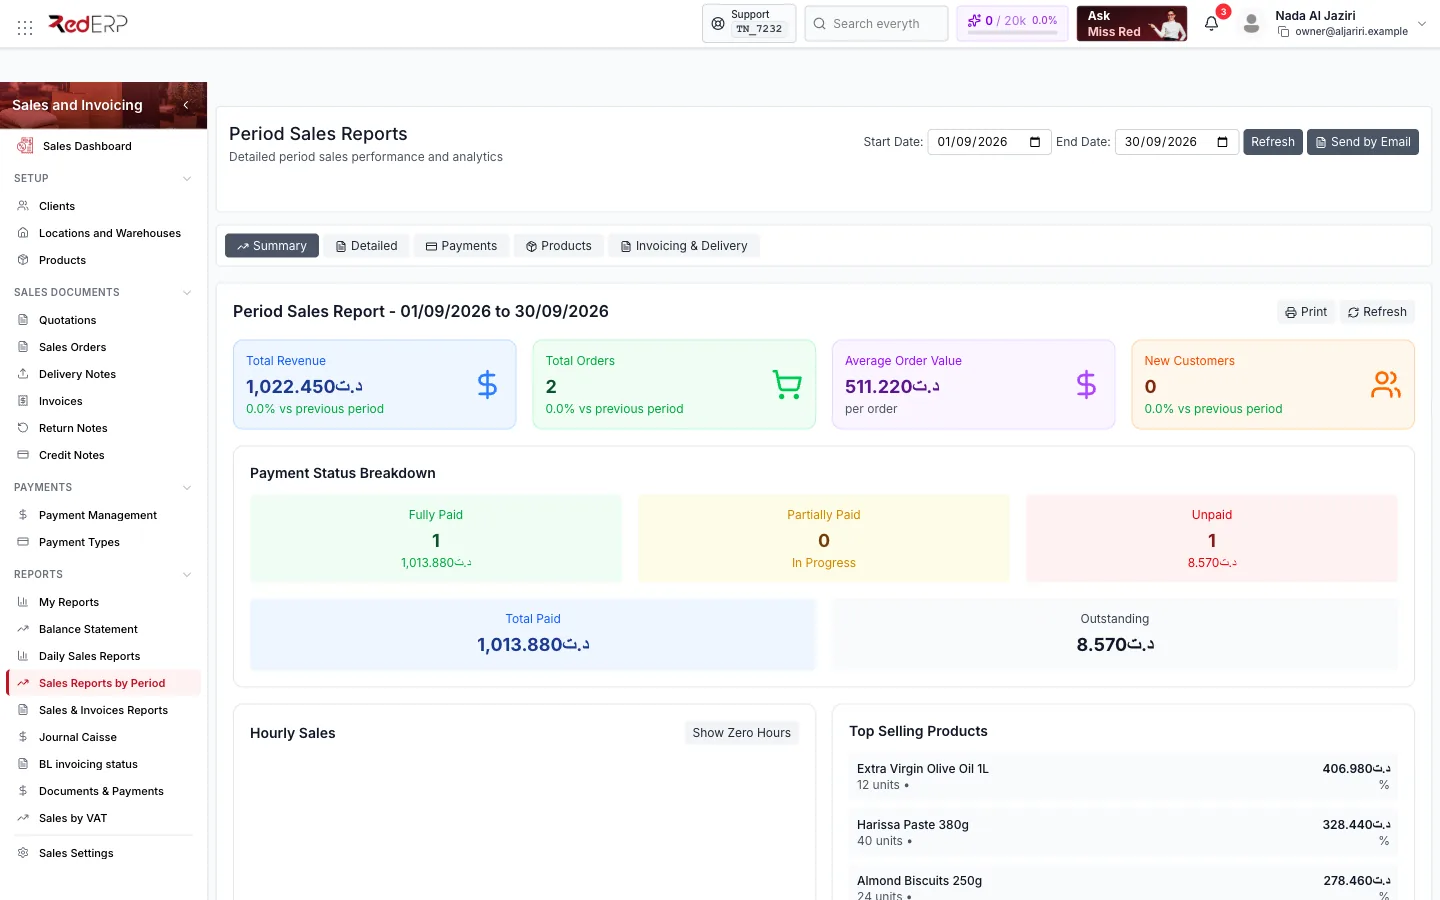
Screen tour
| Area | What it shows |
|---|---|
| Header | Start Date, End Date, Refresh, Send by Email |
| Tabs | Summary, Detailed, Payments, Products, Invoicing & Delivery |
| Report header | Period Sales Report — dd/mm/yyyy to dd/mm/yyyy, Print, Refresh |
| KPI cards | Total Revenue, Total Orders, Average Order Value, New Customers, each vs previous period |
| Payment Status Breakdown | Fully Paid, Partially Paid, Unpaid, Total Paid, Outstanding |
| Hourly Sales | Average hourly profile over the period (Show Zero Hours) |
| Top Selling Products | Units, revenue and share |
How to use it
Choose the range
Set Start Date and End Date (the current month is proposed) and Refresh.
Read the comparison
Each KPI shows the percentage change against the previous period of identical length — the month before for a monthly range.
Drill down
Switch to Detailed for the document list, Payments for methods, Products for the full ranking and Invoicing & Delivery for what is still open.
Share
Print or Send by Email.
Logic and rules
- Same definitions as the Daily Sales Report: invoices and delivery notes dated in the range, Completed payments, first-document clients.
- The previous period is computed automatically: same number of days immediately before the start date.
- Branch scope applies.